
Overview
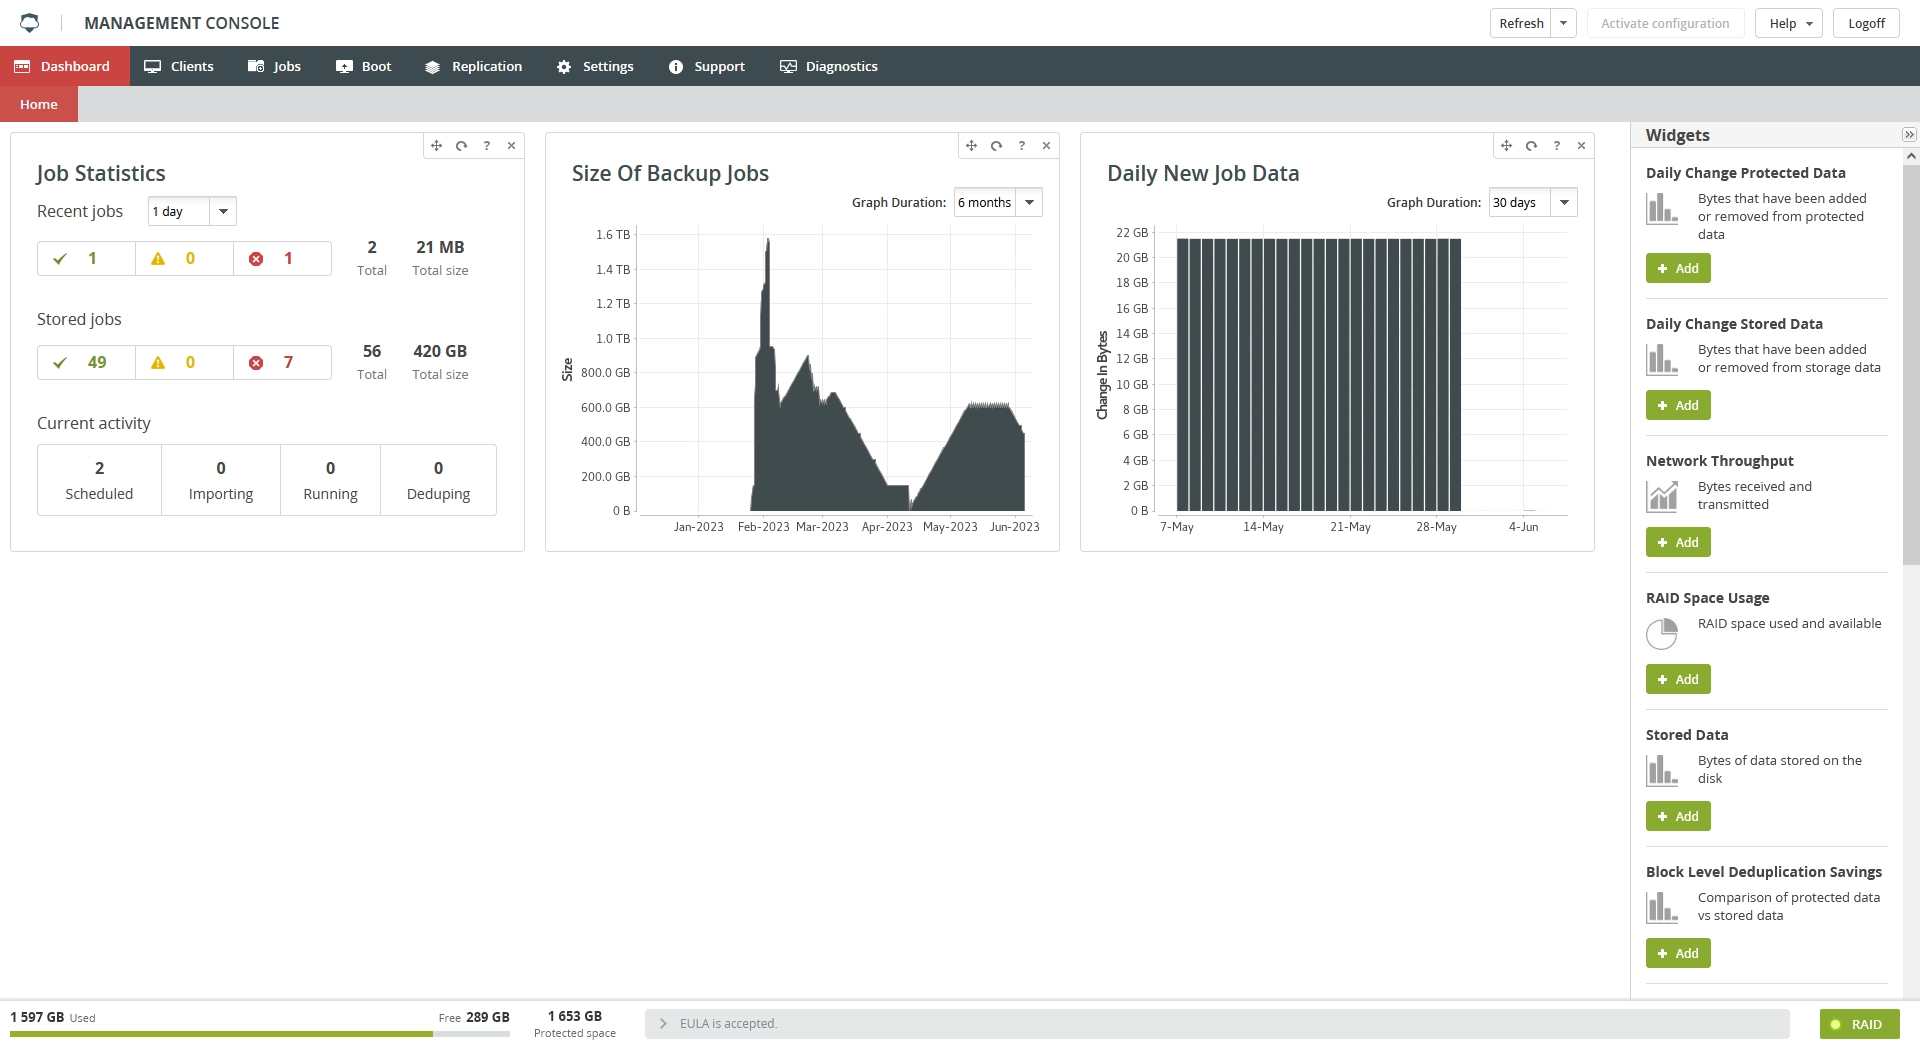
Management Console is the primary point of interaction with Backup & Disaster Recovery appliance. It allows:
configuring the appliance settings
viewing the appliance status
configuring the clients
managing the backup data
managing the backup and the restore jobs
boot the backups as VMs running on appliance
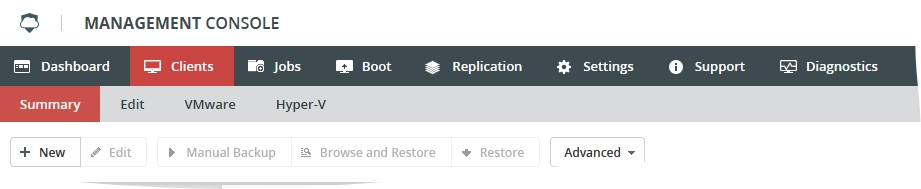
Navigation menu
To navigate within the Management Console, use the tab menu on the upper left.
The navigation menu consists of tabs and subtabs, if any. Subtabs vary from tab to tab.
Activating changes
Whenever you change settings or otherwise modify the current configuration, the Activate Configuration button on the upper right becomes active. Click it to save changes or modifications.
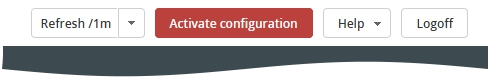
Appliance lets most configuration changes be made at any time by clicking Activate Configuration. When adding new clients or adding some job types, all currently running backups must finish before the new clients will be registered. Shortly after clicking Activate Configuration, a dialog will acknowledge that changes have been made.
Help menu
The Help menu provides a number of options to help you manage and get extra information about appliance and the Management Console.
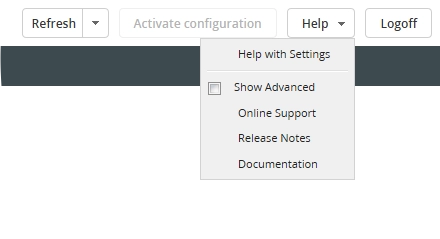
| Item | Description |
|---|---|
| Help with | Go to the Infrascale Documentation Portal to view information about the current tab or subtab |
| Show Advanced | Turn on the Advanced user interface mode. This shows or hides the elements of the Management Console that are not needed for everyday use. |
| Online Support | Go to the Infrascale Support webpage |
| Release Notes | Go to the Infrascale Documentation Portal to view release notes for Backup & Disaster Recovery |
| Documentation | Go to the Infrascale Documentation Portal to explore the related documentation |
Storage bar
The Storage bar on the lower left shows information about the disk space on appliance.
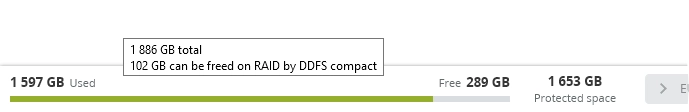
You can view the basic information (used space, free space, and protected space), and the extra information (total space, and space that can be freed).
To show extra information, hover over the bar.
Info bar
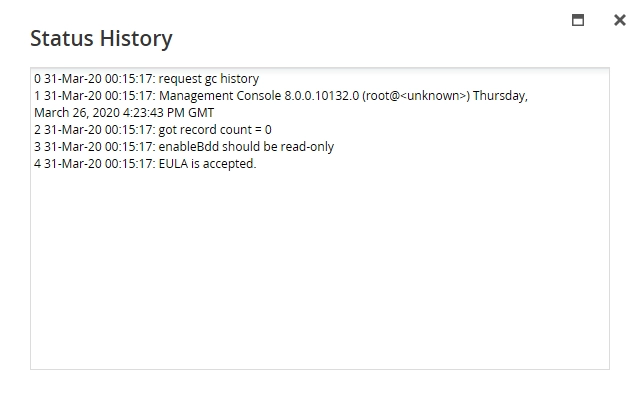
The Info bar in the lower part shows the latest event from the status history of the Backup & Disaster Recovery appliance.
Click the bar to show the complete status history.
Notices
The View Notices button on the lower right appears if something on appliance requires your attention. Click it to show all current notices.
RAID bar
The RAID bar on the lower right indicates the status of the appliance RAID.
If the RAID bar is green, this means the RAID system has no issues and operates normally.
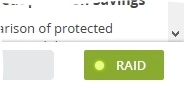
If the RAID bar is red, this means the RAID system has some issues and requires your attention.
Click the RAID bar to go to the RAID Configuration page.
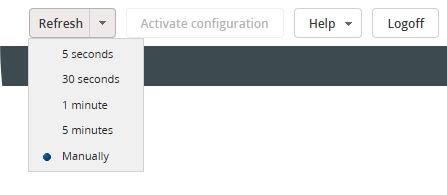
Refresh
By default, information on most tabs and subtabs refreshes automatically each minute.
To instantly refresh the information, click the Refresh button on the upper right.
To change the refreshing interval, click the down arrow on the right, and select the desired interval from the drop-down list.
To turn off the automatic refreshing, click the down arrow on the right, and then select Manually from the drop-down list.
Filters
Just to the right top of the window there is a Filters menu on major part of the tabs. Filters can be applied throughout most of the user interface, wherever tables of information are displayed. The available filters will change based on the tab or page that you are viewing.
To enable or disable filtering, click the Filter button.
For example, if you enabled filtering on the Clients › Summary screen, the following line would appear at the top of the list of clients:
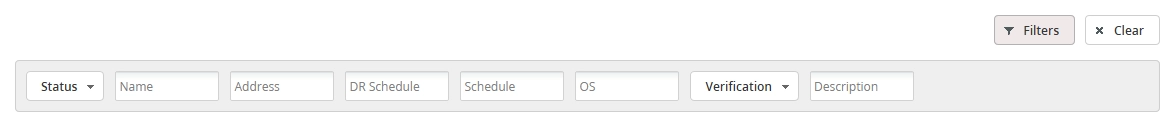
This example shows two types of filters:
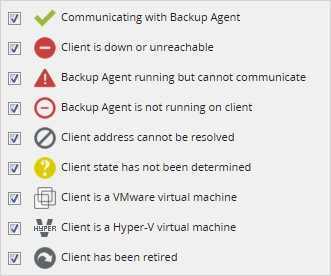
The Status filter is a drop-down menu on which you select the checkboxes to show only clients with one or more particular status types. (By default, all status types are checked, so that status filtering occurs only when you clear one or more checkboxes.)
The other filters (Name, Address, and so on) are text-based filters to type in the name or other information to match, in one or more columns. Filter entries are not case-sensitive, and partial filter entries can be used—for example, all names beginning with
dorda.
Another example is from the Jobs › History screen:
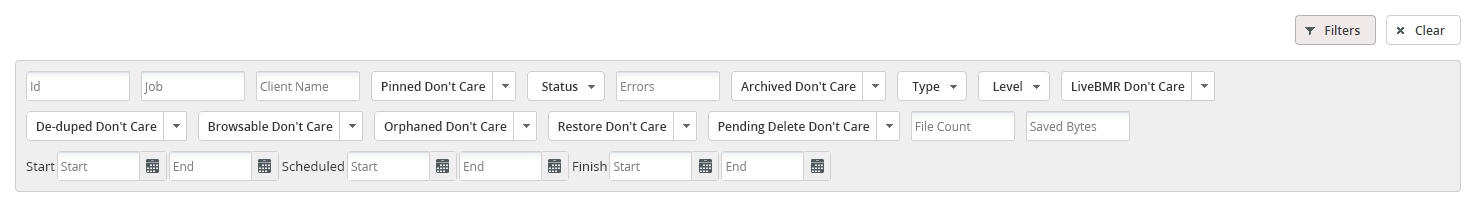
In this example, note the following:
For numeric values (such as Id and Errors), you can enter either individual numbers or a range of numbers. For example,
100-110would list all jobs with job IDs numbered from100to110.You can click some buttons (or use their drop-down menus) to toggle through attributes. For example, if you click the Archived Don’t Care button multiple times, it will change to Archived Is Set then Archived Is Not Set and finally back to the original setting, indicating if to filter based on the Archived attribute or not.
You can filter job entries based on when they started, when they are scheduled to run, and when they finished. For each of these attributes, you can enter the start and the end dates either manually or by clicking the calendar icon.
Whatever filters you set, the respective screen will list only the items that meet all of the filter criteria. For example, in Jobs › History, if you enter values in the Id and Client Name fields and toggled the archiving button to Archived Is Set (and did not change any other of the filters shown), the screen would display only archived jobs for the named client in the specified range of job IDs.
Filtering applies until you either remove the filtering qualifications or click Clear button, which is from the right side from the Filters button.
Columns and sorting
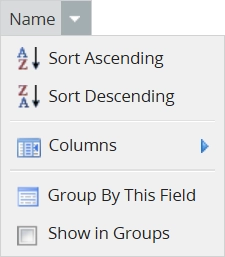
Page content is highly customizable. You can select which column to sort the screen on by clicking the column heading. In the example below, columns are assorted by the Name column, in ascending order. You could click the Name column heading to change the sort order to descending, or you could click a different column heading to sort by that column instead.
You can also change column widths, and you can reorder columns by dragging-and-dropping them into the desired order.
By clicking the drop-down menu attached to each column heading, you can also:
Change the column sort order to ascending or descending (another method to do this)
Add columns to or remove columns from the view. Not all columns are visible by default.
Group screen entries according to the items in the selected column, for example, you can group by clients or by backup level.
Pagination
Pagination is another new feature in the user interface. You can move from page to page using the navigation buttons (or typing the page number) at the bottom of the window. The default number of records displayed on each page is 25. You can change this number in the Page Size text box.
