
Overview
To browse and view the full history of backup events related to Infrascale Backup & Disaster Recovery, as well as to Infrascale Cloud Backup, and to Infrascale Cloud Application Backup:
Sign in to your account in the Dashboard.
Go to Disaster Recovery › Backup Status.
Also, you can go to Endpoint Backup › Backup Status, or to Application Backup › Backup Status.
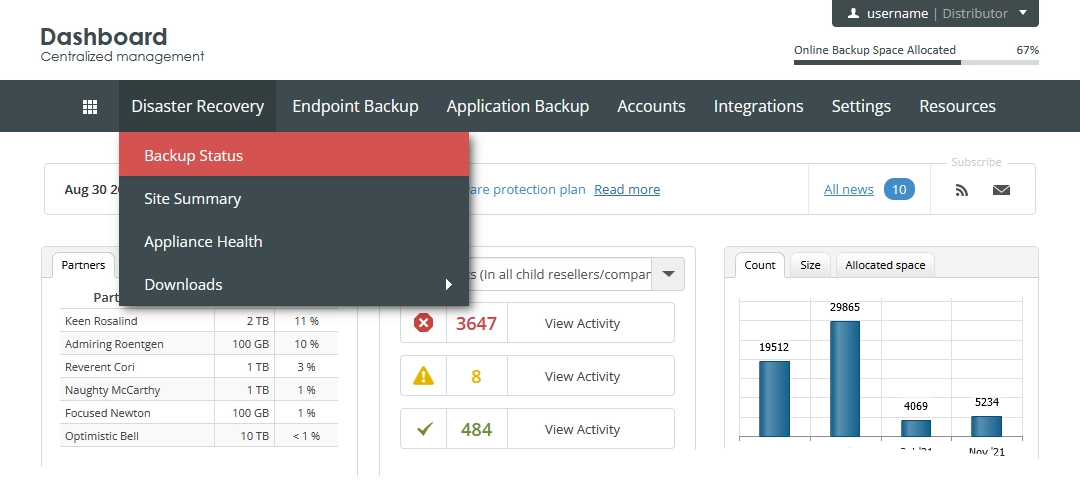
The backup status monitoring page opens.
Click View All Events.
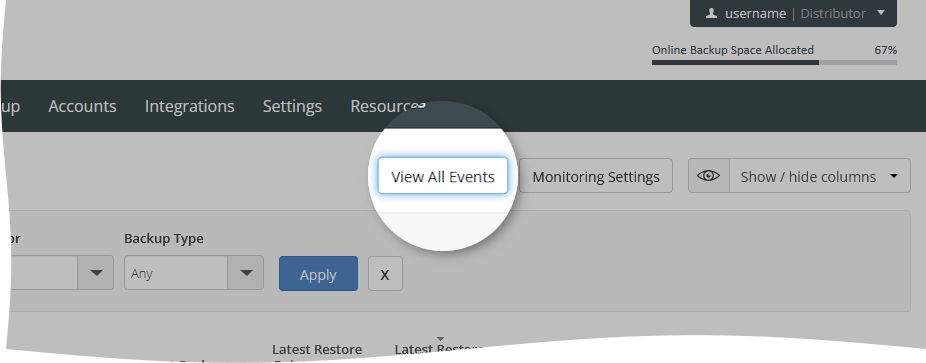
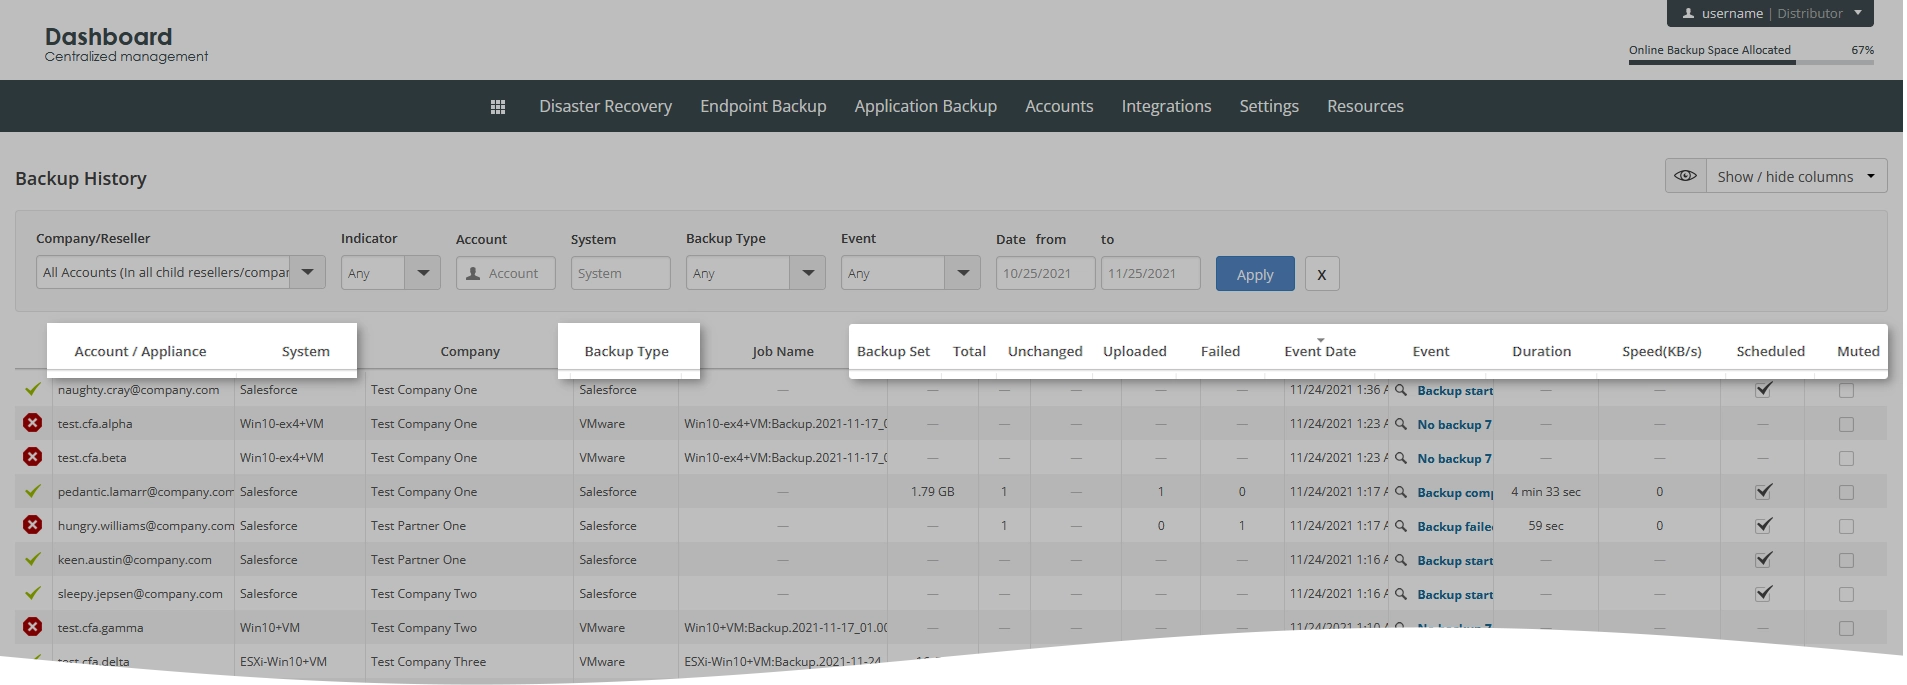
The backup history page opens.
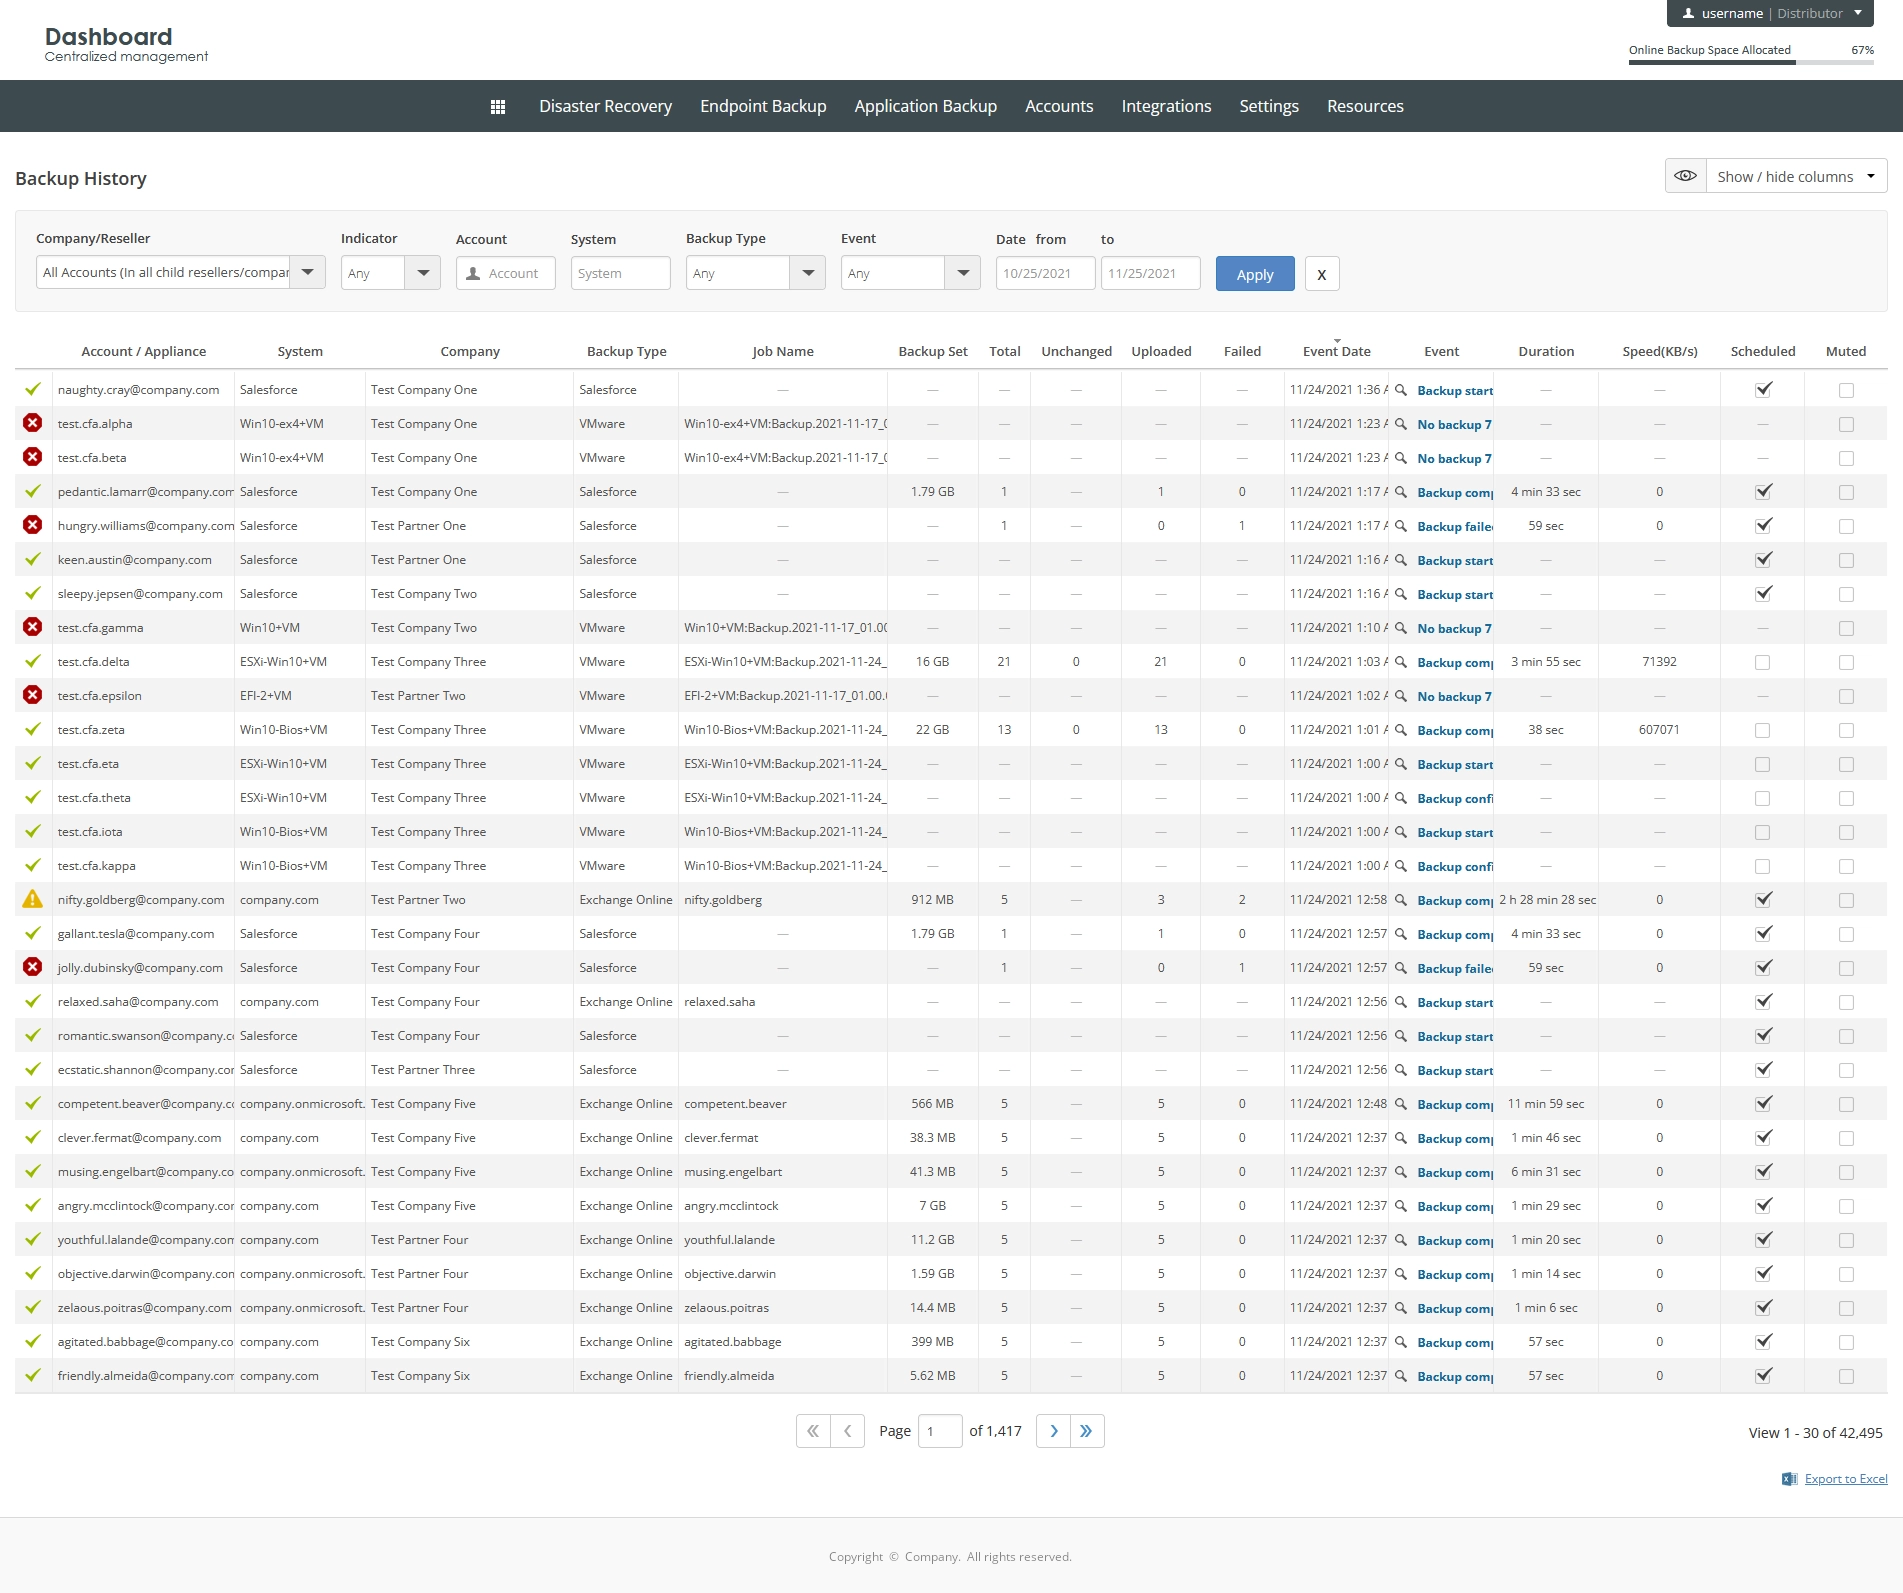
Information on the page is presented in the table format with the following columns:
| Column | Description |
|---|---|
| Indicator | Indicator of the backup event: Error, OK, or Warning |
| Account / Appliance | Username of the backup account or name of the Backup & Disaster Recovery appliance |
| System | Name of the protected endpoint, protected device, or protected domain |
| Company | Name of the company the appliance is registered under, or the backup accounts belongs to, or CAB is turned on for |
| Backup Type | Type of the backup |
| Job Name | |
| Backup Set | Size of the backup set |
| Total | Total number of files in the backup set |
| Unchanged | Number of unmodified files in the backup set since the last backup |
| Uploaded | Number of files in the backup set protected and uploaded to the cloud |
| Failed | Number of files in the backup set that could not be protected and uploaded to the cloud |
| Event Date | Date of the backup event |
| Event | Status of the backup event |
| Duration | Duration of the backup event |
| Speed | Speed of transferring of the protected data to the cloud |
| Scheduled | |
| Muted | Indication if the events—that is, alerts, notifications, reports, and so on—are suspended for the protected endpoint, protected device, or protected domain |
Navigate
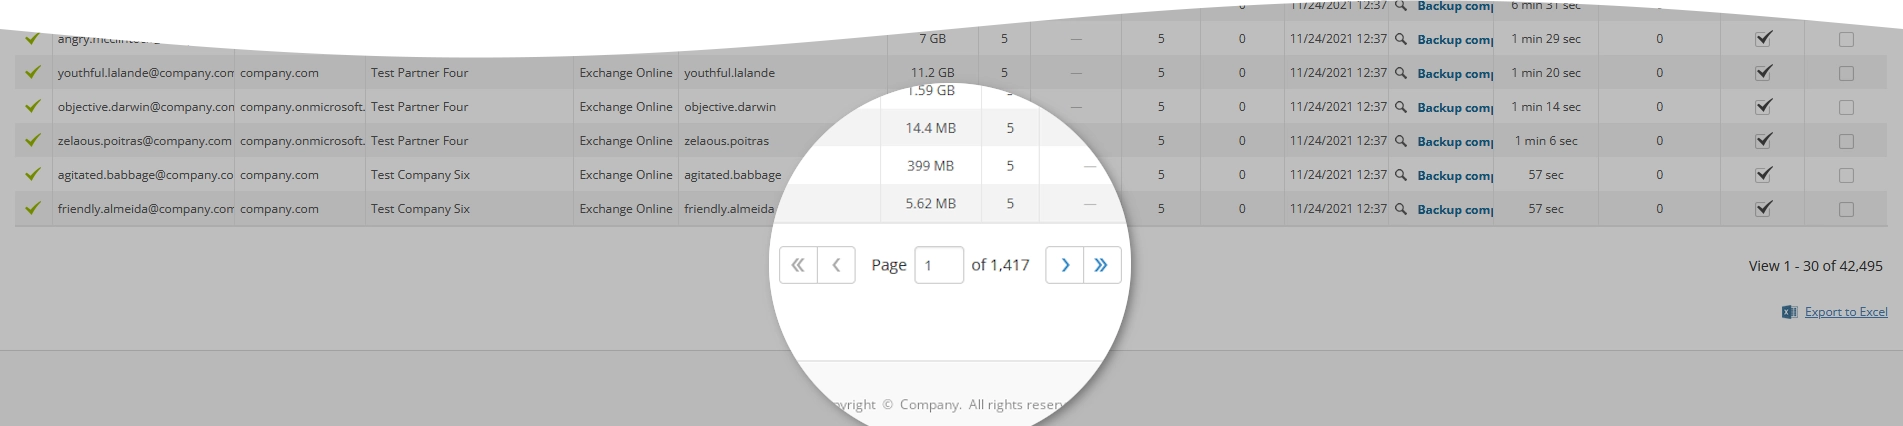
By default, the system shows 30 backup event records in the table per page. To browse over the backup events, use the navigation buttons at the bottom of the page. Also, you can enter a number in the box, and then press Enter to go to the respective page.
| Name | Icon | Description |
|---|---|---|
| Next | Go to the next page | |
| Previous | Go to the previous page | |
| Last | Go to the last page | |
| First | Go to the first page |
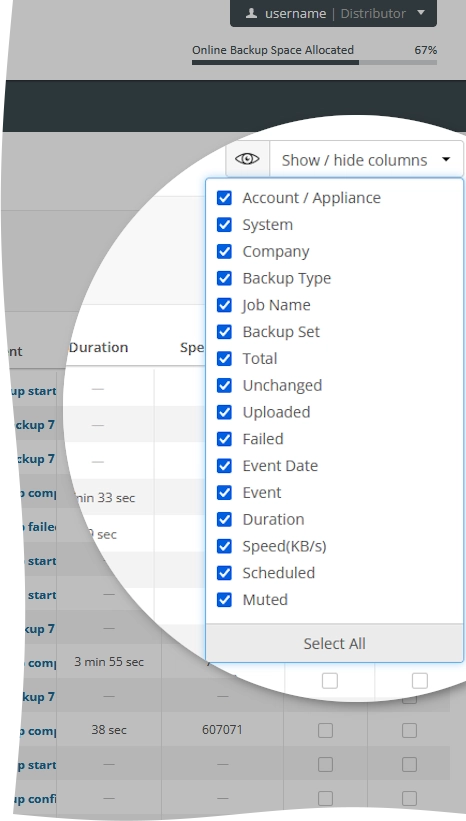
Show or hide data
You can select what data to show on the page. For this, click Show / hide columns, and then select or clear the columns you want to show or hide.
Sort data
You can sort backup events in the table in ascending or descending order by:
username of the backup account or name of the appliance (Account / Appliance),
name of the protected endpoint, protected device, or protected domain (System),
type of the backup (Backup Type),
size of the backup set (Backup Set),
total number of files in the backup set (Total),
number of unmodified files in the backup set since the last backup (Unchanged),
number of files in the backup set protected and uploaded to the cloud (Uploaded),
number of files in the backup set that could not be protected and uploaded to the cloud (Failed),
date of the backup event (Event Date),
status of the backup event (Event),
duration of the backup event (Duration),
speed of transferring of the protected data to the cloud (Speed),
Scheduled, or
indication if the events are suspended for the protected endpoint, protected device, or protected domain (Muted).
For this, click the name of the corresponding column.
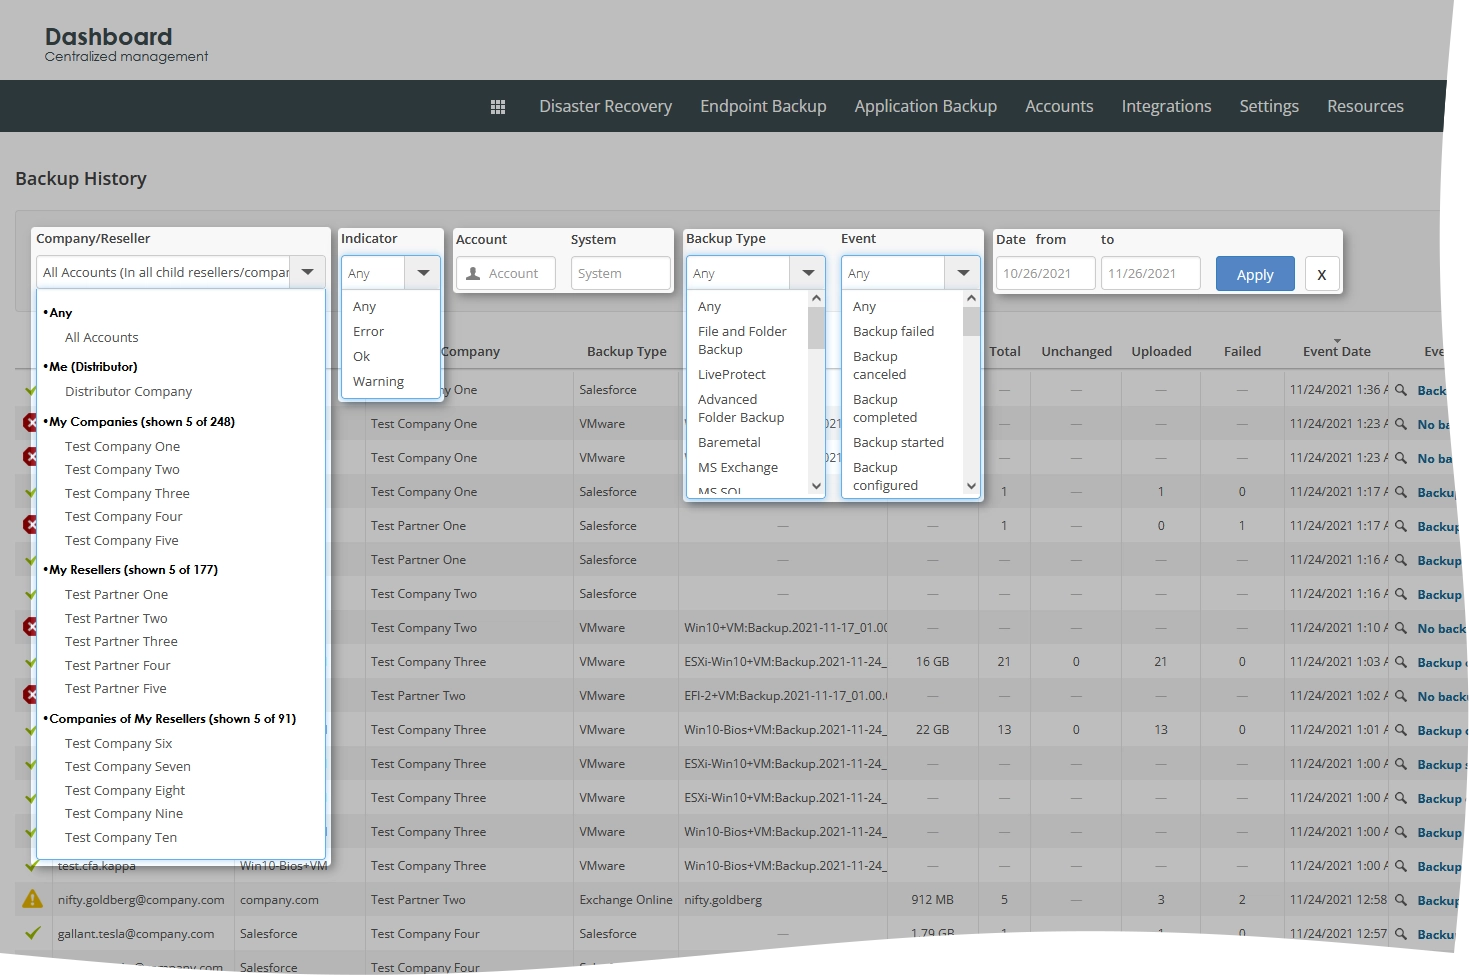
Filter data
You can filter events in the table by:
partner (Company/Reseller, for distributors only),
company (Company/Reseller, for distributors and partners),
indicator of the backup event (Indicator),
username of the backup account or name of the appliance (Account),
name of the protected endpoint, protected device, or protected domain (System),
type of the backup (Backup Type),
status of the backup event (Event), and
date of the backup event (Date from and Date to).
For this, set the desired filters on the toolbar, and then click Apply.
To reset all filters at once, click Clear (
) next to the filters on the toolbar.
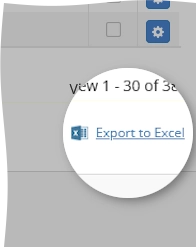
Export data
You can export all data (in all visible and hidden columns) in the table to an XLS spreadsheet. For this, click Export to Excel on the lower right, and then save the file with the exported data to the desired location.
View backup account summary
If an event relates to a backup account, you can view the backup account summary. For this:
Find a backup account of interest.
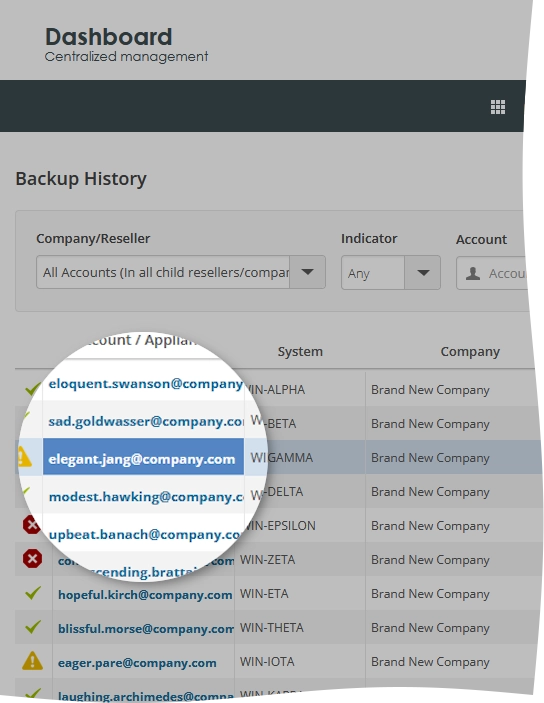
In the Account / Appliance column of the backup account record, click the backup account username.
The backup account summary opens.

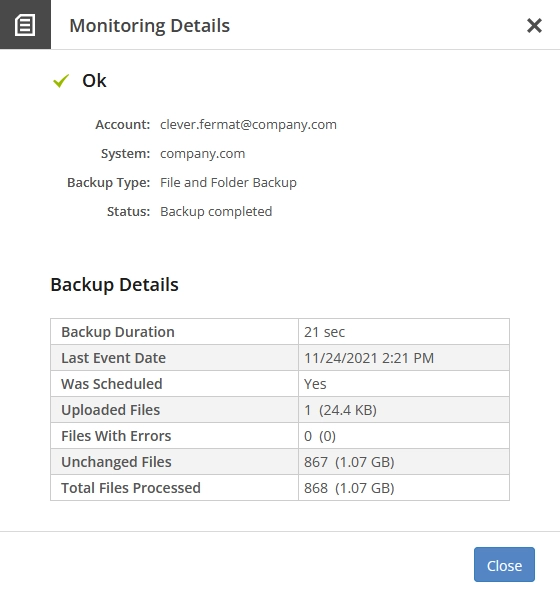
View event details
To view the details of the a backup event:
Find a backup event of interest.
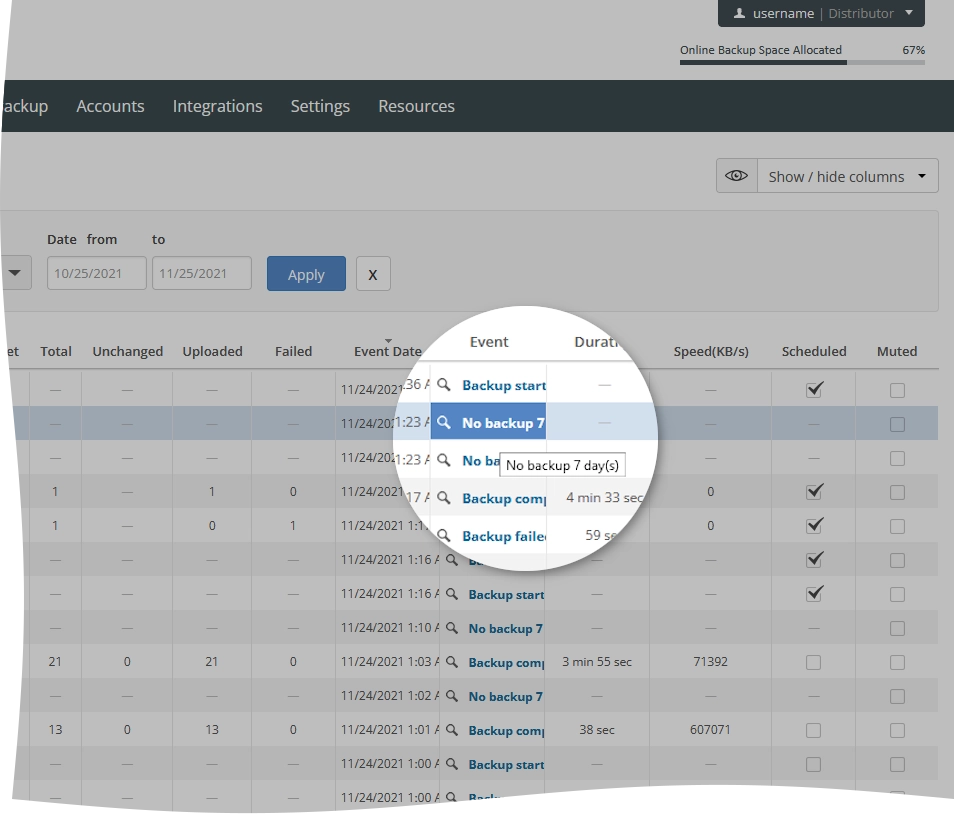
In the Event column of the backup event record, click the status of the backup event.
The backup event details open.
Get recovery report
If you are a company administrator, you can generate and download a report about the recovery events within the company. For this:
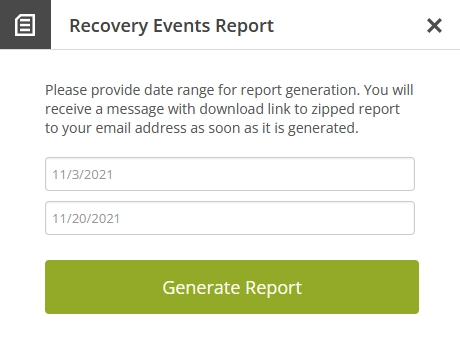
Click Recovery Events Report.
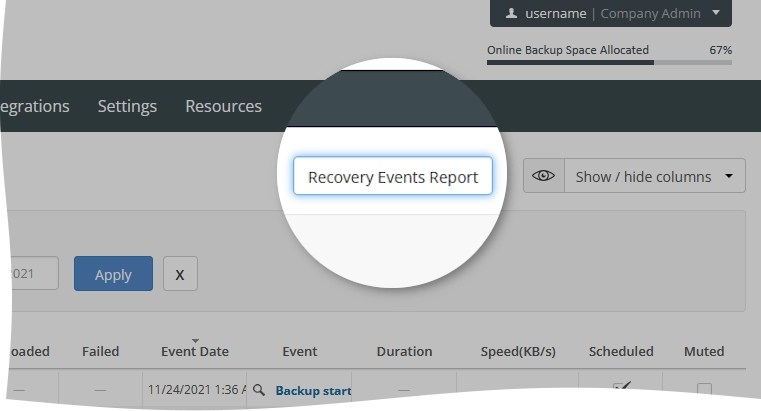
The Recovery Events Report dialog opens.
Set the date range to generate the report for, and then click Generate Report.
If you do not want to generate the report, click Close (
 ) or press Esc to close the dialog.