Overview
This section documents the Dashboard tab, which is basically allow monitoring of the Backup & Disaster Recovery appliance. The Dashboard tab will be the first screen to display when you log in to your appliance once you have completed the quick start wizard. This screen has a number of widgets available to add to your display to customize your view to the information you want.

Widgets
We have a number of widgets that will provide you with some statistics about your machine, such as raid usage, recent job activity, replication transfer, and so on. You can swap the widgets in and out and reorder them on your screen as you need. Which widgets you have loaded, and the order they are displayed in will be saved in a cookie so you do not have to reconfigure it each time you log in.
To add a widget to the display simply select a widget out of the list on the right of the screen and click the add button. The widgets will be added to the page in the order you add them in, with each new one being added to the right of the previously added widget.
Widgets have a number of control buttons: ![]() .
.
The first button allows dragging widgets so you can order the information presented in the way you feel is most convenient to you. The second button refreshes the information displayed in the widget. The third gives you a description of what information that widget displays. The last button closes the widget and returns it back to the list on the right.
Notices
If the appliance has any type of notice, this widget will display them with the ability to click a notice for more information. If there are no notices, this widget will automatically be hidden. If shown this widget will always be first.

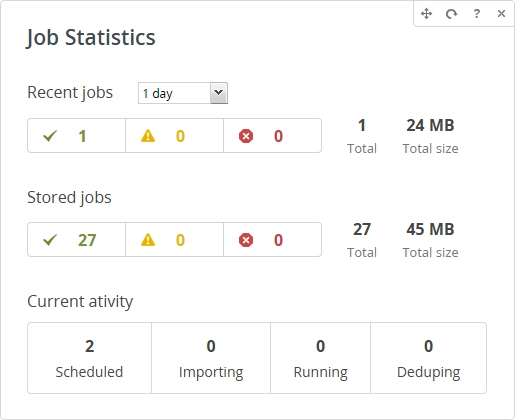
Job Statistics
- Recent Activity
- Summarizes jobs that have completed within the duration selected. These represent the historical record of jobs, and not necessarily jobs that are currently stored on the appliance.
- Stored Jobs
- Summarizes all jobs that are currently stored on the appliance. If automatic deletion of erred jobs is set, this will only show erred jobs until they are automatically deleted.
- Current Activity
- Shows jobs that are in either scheduled to run or are currently in the process of running or post-processing.
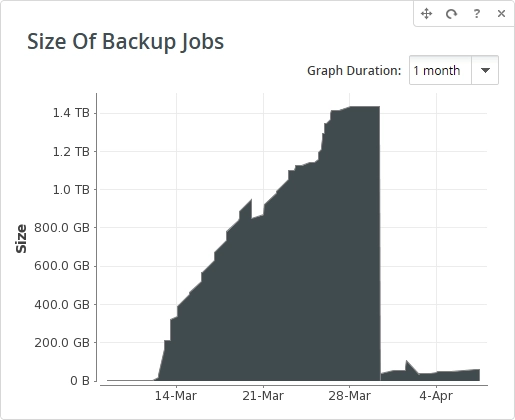
Size Of Backup Jobs
Shows a historical plot of the amount of data in bytes the appliance is protecting for the given time period. Size of backup jobs is the sum of all successful backup jobs at any given point in time.
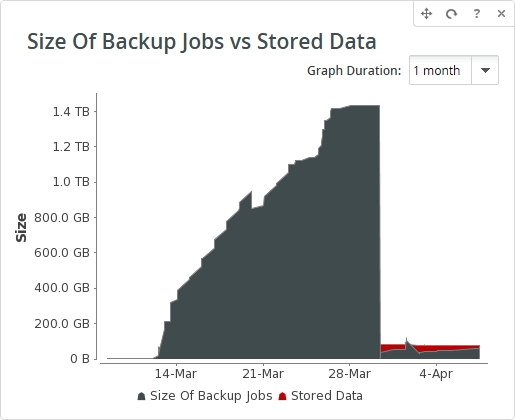
Size Of Backup Jobs vs Stored Data
Shows comparison of the protected data and the stored data. Protected data is the sum of all successful backup jobs at any given point in time. Stored data is the job data that occupies physical space on the RAID.
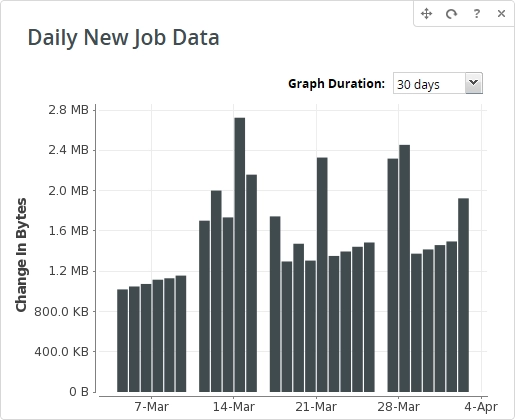
Daily New Job Data
Shows a historical plot of the bytes of new job data shown for the given time period. This graph shows how much new backups are added to the appliance each day.
Daily Change Protected Data
Shows a historical plot of the net change in the protected data bytes for the given time period. This graph takes into account jobs that have been added and removed from appliance each day. Protected data is the sum of all successful backup jobs at any given point in time.

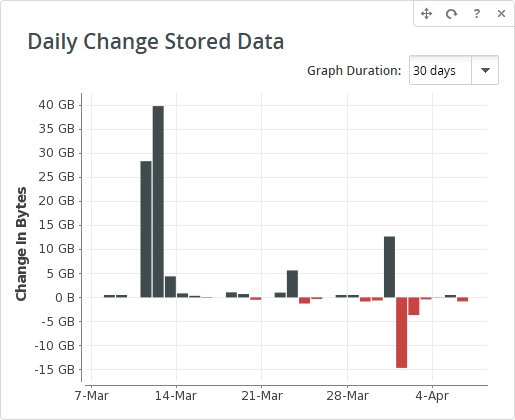
Daily Change Stored Data
Shows a historical plot of the net change in RAID storage bytes for the given time period.
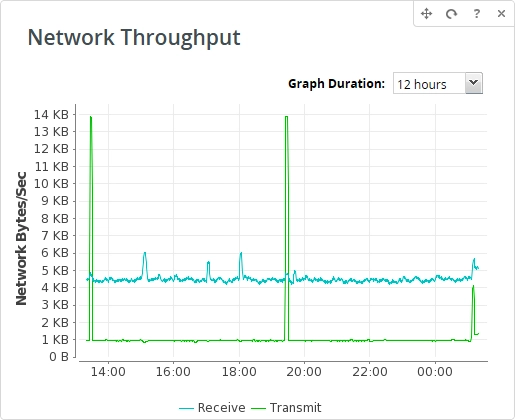
Network Throughput
Shows a historical plot of the number of bytes per second the appliance is receiving and transmitting across all network interfaces for the given time period.
RAID Space Usage
This pie chart shows the RAID space used (red) vs available (green).

Stored Data
Shows a historical plot of the amount of bytes stored on the RAID for the given time period.

Replication Transfer Rate
Shows a historical plot of replication throughput in bytes per second for the given time period. Network values show the actual bytes sent over the wire.
![]()
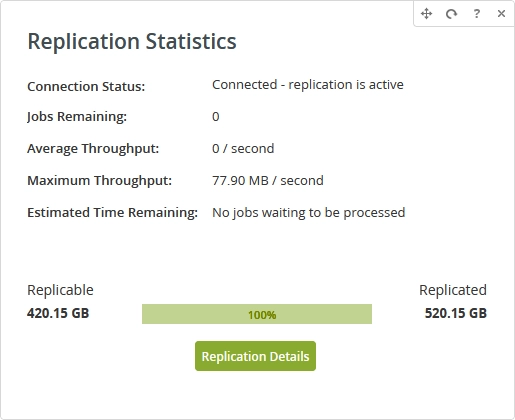
Replication Statistics
Shows a summary of the current state of replication. Includes a rough estimate of the time remaining to transfer all selected data. The estimate takes into consideration the historical compression rates from past job deltas (if enabled) and current transfer rates.
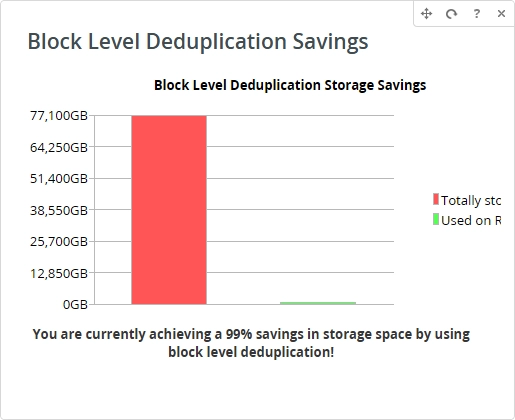
Block Level Deduplication Savings
Comparison of protected data vs stored data. Protected data is the sum of all successful backup jobs at any given point in time. Stored data is job data that occupies physical space on the RAID.
This widget is visible in the Advanced mode only. To show the widget, click Help › Show Advanced on the upper right.
Disk I/O Operations
Shows a historical plot of the number of disk I/O operations (read and writes) for both Storage and Catalog volumes for the given time period.
This widget is visible in the Advanced mode only. To show the widget, click Help › Show Advanced on the upper right.

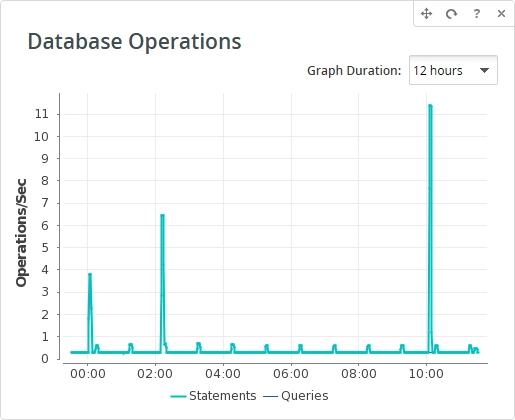
Database Operations
Shows a historical plot of the number of database operations/second for the given time period.
This widget is visible in the Advanced mode only. To show the widget, click Help › Show Advanced on the upper right.
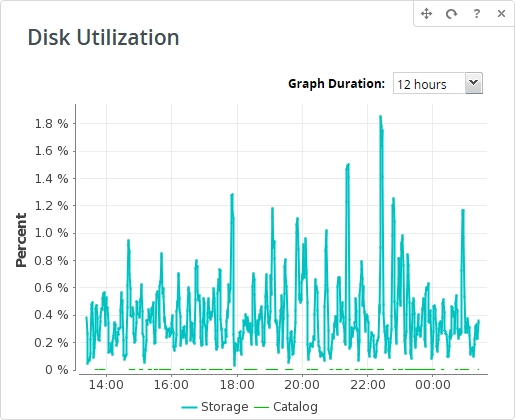
Disk Utilization
Shows a historical plot of the percentage of time the disks are busy for the given time period.
This widget is visible in the Advanced mode only. To show the widget, click Help › Show Advanced on the upper right.
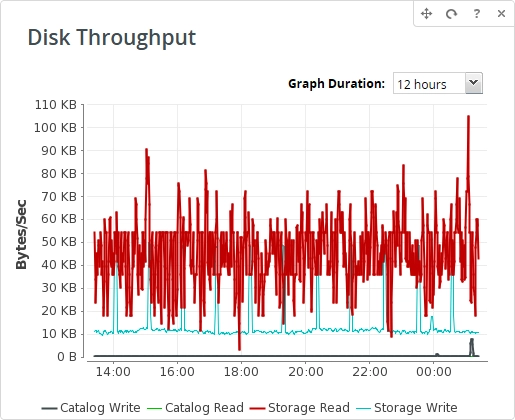
Disk Throughput
Shows a historical plot of the number of bytes/second transferred to and from the catalog and storage volumes for the given time period.
This widget is visible in the Advanced mode only. To show the widget, click Help › Show Advanced on the upper right.