Overview
To browse and view the monitoring data regarding the Backup & Disaster Recovery appliances:
Sign in to your account in the Dashboard.
Go to Disaster Recovery › Appliance Health.
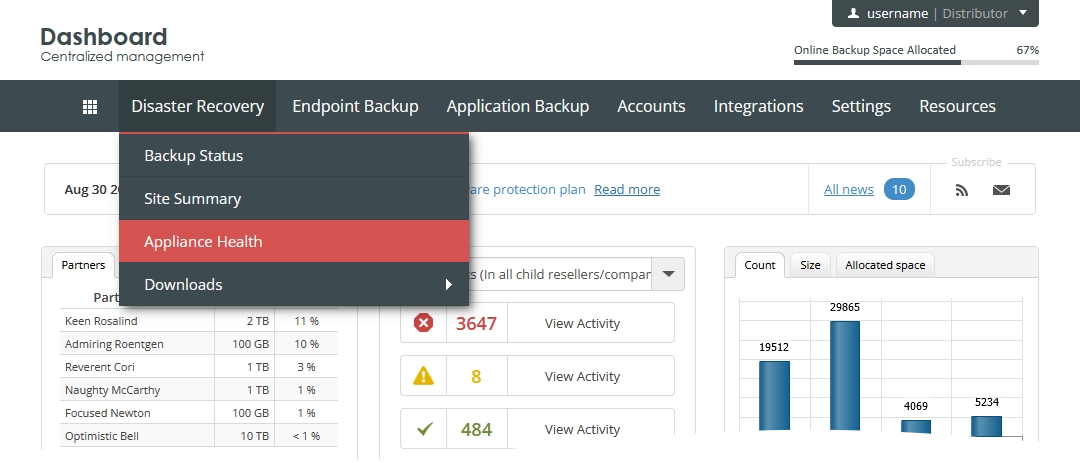
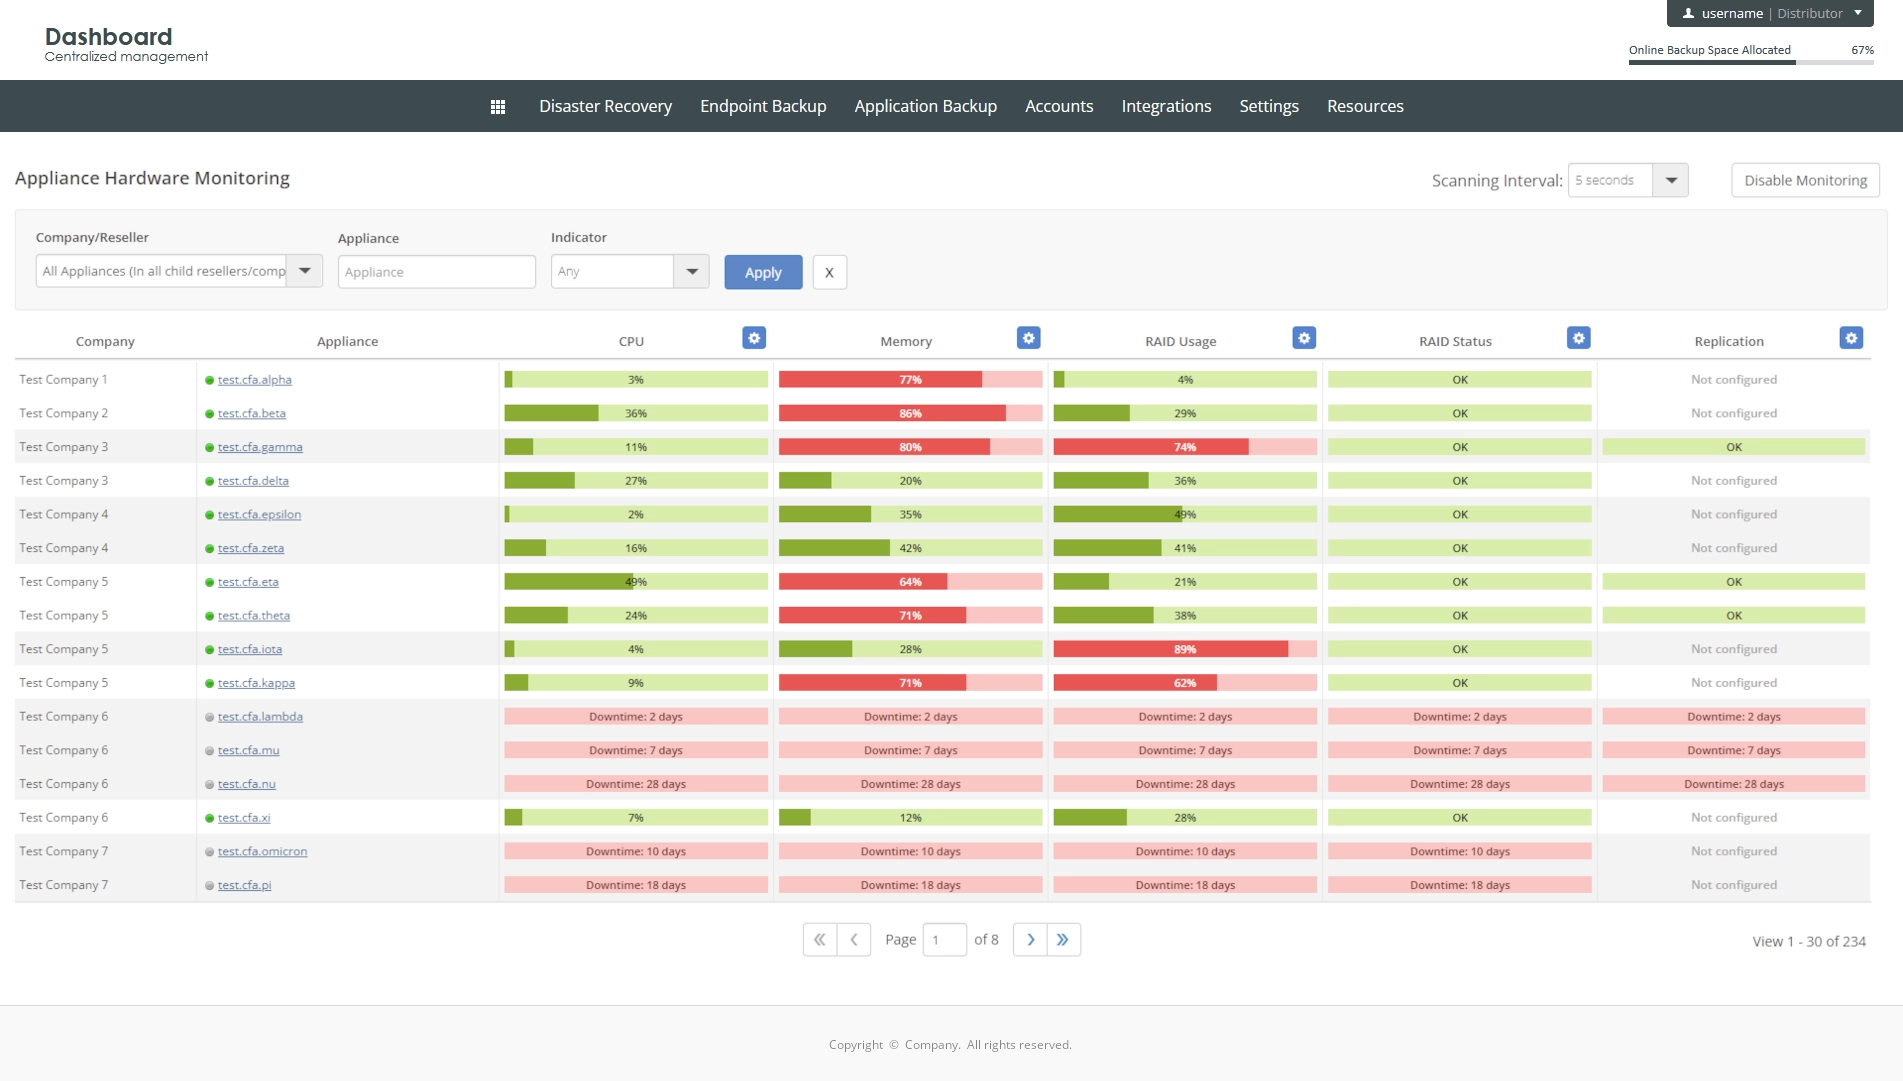
Appliance monitoring page opens.
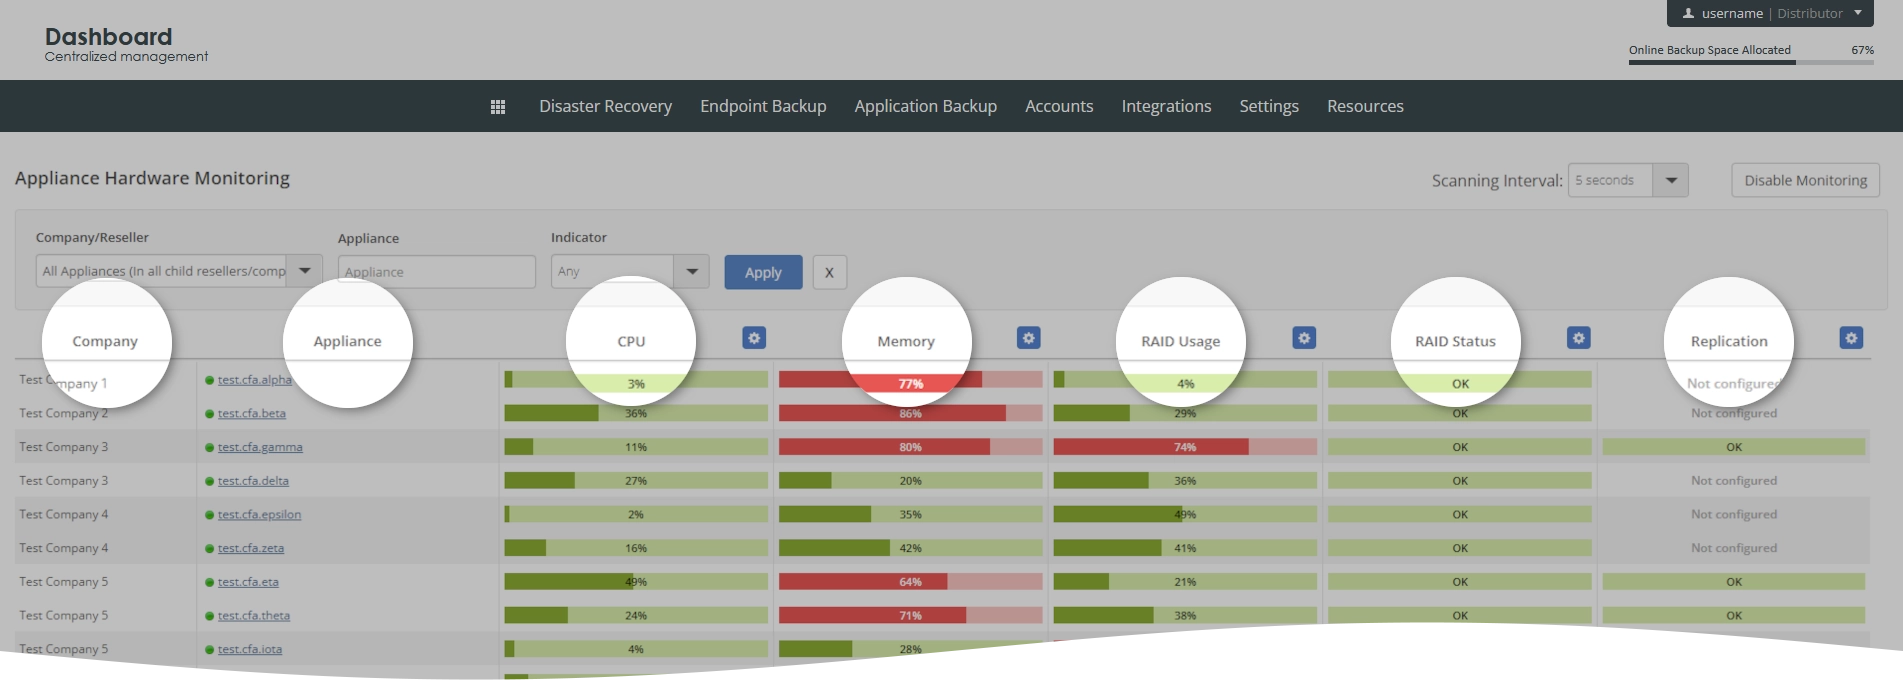
Information on the page is presented in the table format with the following columns:
| Column | Description |
|---|---|
| Company | Name of the company the appliance is registered under in the Dashboard |
| Appliance | Name of the appliance |
| CPU | Use of the appliance processor |
| Memory | Use of the appliance memory |
| RAID Usage | Use of the appliance RAID |
| RAID Status | Health status of the appliance RAID |
| Replication | Status of the replication |
Navigate
By default, the system shows 30 appliance records in the table per page. To browse over appliances, use the navigation buttons at the bottom of the page. Also, you can enter a number in the box, and then press Enter to go to the respective page.

| Name | Icon | Description |
|---|---|---|
| Next | Go to the next page | |
| Previous | Go to the previous page | |
| Last | Go to the last page | |
| First | Go to the first page |
Sort data
You can sort appliances in the table in ascending or descending order by:
name of the company (Company),
name of the appliance (Appliance),
use of the appliance processor (CPU),
use of the appliance memory (Memory),
use of the appliance RAID (RAID Usage),
health status of the appliance RAID (RAID Status), or
status of the replication (Replication).
For this, click the name of the corresponding column.
Filter data
You can filter appliances in the table by:
partner (Company/Reseller, for distributors only),
company (Company/Reseller, for distributors and partners),
name of the appliance (Appliance), and
indicator of the appliance status (Indicator).
For this, set the desired filters on the toolbar, and then click Apply.

To reset all filters at once, click Clear (![]() ) next to the filters on the toolbar.
) next to the filters on the toolbar.
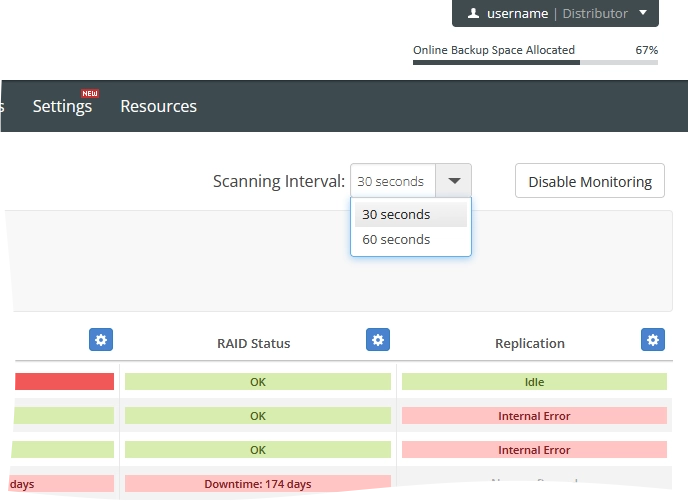
Set scanning interval
By default, the system queries the sensors and updates monitoring data on the page every five seconds. You can change this by setting another scanning interval. For this, click Scanning Interval on the upper right, and select one of the available options: 30 s or 60 s.